
In this article
- Why football data is changing the game
- Why goals and assists don't tell the whole story
- Expected goals (xG): measuring chance quality
- Expected assists (xA): the science of creativity
- Packing rates: the statistic most fans overlook
- The hidden equations shaping every match
- The mathematics behind VAR
- How computers decide the tightest offsides
- Bringing football math into STEM education
- Where football analytics goes next
Why football data is changing the game
For generations, football analysis revolved around a small collection of familiar statistics. Goals, assists, clean sheets, and passing percentages provided a basic framework for evaluating players and teams. However, as the sport became more competitive and technology evolved, analysts began to realize that these metrics often failed to capture a player’s true contribution on the pitch.
Today, football data has transformed how clubs evaluate performance and develop tactics. Modern tracking systems generate millions of observations, creating opportunities to analyze football through the lens of probability, statistics, geometry, and machine learning.
The result is a new era of football stats, powered by sophisticated mathematical models that can quantify aspects of the game previously impossible to measure.
Why goals and assists don’t tell the whole story
Traditional statistics focus on outcomes. While outcomes ultimately determine matches, they do not always explain how those outcomes were achieved.
Consider two midfielders who each finish a season with ten assists. One may have consistently created high-quality scoring opportunities, while the other benefited from exceptional finishing by teammates. Similarly, two strikers may score the same number of goals despite generating very different shooting profiles.
This challenge has motivated analysts to develop advanced metrics that evaluate the quality of actions rather than simply counting results.
The objective of modern football math is not to replace traditional statistics but to provide additional context that improves decision-making.
Expected goals (xG): measuring chance quality
Expected Goals, commonly known as xG, estimates the probability that a shot will result in a goal.
Instead of treating all shots equally, xG models analyze a variety of variables, including shooting distance, angle to goal, defensive pressure, body part used, goalkeeper position, and pass type.
Most modern xG systems rely on logistic regression models trained using large datasets of historical shots. The model first combines the different variables into a single value:
where:
β0 = intercept term
βi = coefficient associated with variable xᵢ
xᵢ = shot characteristic being analyzed
The value z is then transformed into a probability using the logistic function:
This transformation ensures that the final result always falls between 0 and 1, making it suitable for representing the probability of scoring.
For example, a penalty kick may receive an xG value close to 0.76, indicating that historically around 76 % of similar shots result in goals. In contrast, a speculative effort from long range may receive an xG value below 0.05.
By comparing expected goals with actual goals over time, analysts can identify players who consistently outperform or underperform the quality of chances they receive.
Historical leaders in xG performance
Several players have repeatedly ranked among football’s most efficient finishers when comparing goals scored to expected goals.
Among the most notable examples are Lionel Messi, Harry Kane, Robert Lewandowski, Cristiano Ronaldo, and Erling Haaland. In women’s football, players such as Sam Kerr, Vivianne Miedema, and Alex Morgan have also demonstrated remarkable efficiency in converting high-quality chances. Their ability to score at rates that often exceed model predictions has attracted significant attention from analysts and researchers.
At the same time, xG can help distinguish between poor finishing and simple bad luck, making it one of the most valuable tools in modern football analytics.
Expected assists (xA): the science of creativity
While xG measures finishing opportunities, Expected Assists focuses on chance creation.
Expected Assists estimates the quality of the scoring opportunities generated by a player’s passes, regardless of whether those opportunities become goals.
The principle behind xA is relatively simple. Every pass that leads directly to a shot inherits the Expected Goals value of that shot. If a pass creates a chance worth 0.30 xG, the passer receives 0.30 xA.
Mathematically, a player’s total Expected Assists can be expressed as:
where:
xGi = Expected Goals value of the shot resulting from pass i
n = total number of chances created
In other words, xA is simply the sum of the Expected Goals generated through a player’s passes.
Consider the following example.
A midfielder creates four shooting opportunities during a match:
Chance 1: 0.35 xG
Chance 2: 0.20 xG
Chance 3: 0.15 xG
Chance 4: 0.40 xG
The player’s Expected Assists total would be:
xA = 0.35 + 0.20 + 0.15 + 0.40
xA = 1.10
This means the player generated chances that would be expected to produce approximately 1.1 goals on average.
One of the key advantages of xA is that it separates creativity from finishing. A player can create excellent opportunities and still record zero assists if teammates fail to score.
For this reason, many analysts consider xA a more reliable measure of playmaking ability than traditional assist totals.
Historical leaders in chance creation
Players such as Kevin De Bruyne, Lionel Messi, Mesut Özil, Thomas Müller, and Bruno Fernandes have consistently ranked among football’s most productive creators. In women’s football, players such as Alexia Putellas, Caroline Graham Hansen, and Beth Mead also stand out for their ability to create high-quality chances and influence attacking play.
Their influence often becomes more apparent when advanced metrics are used alongside traditional football stats, revealing creative contributions that assists alone may fail to capture.
Packing rates: the statistic most fans overlook
One of the most innovative developments in modern football data is the concept of packing.
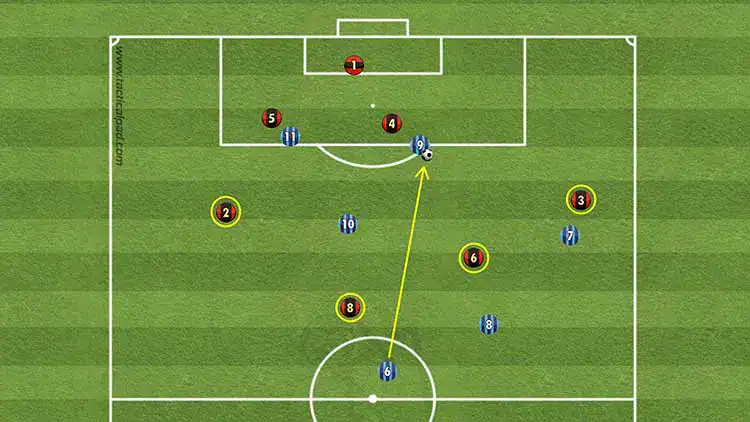
Originally developed to measure how effectively players break defensive structures, packing focuses on the number of opponents bypassed through a single action. Unlike traditional statistics that reward only goals or assists, packing evaluates how players progress the ball and create tactical advantages.
Consider a midfielder who receives possession deep in his own half and delivers a forward pass that instantly removes several defenders from the play. Even if the move does not directly lead to a shot, it may significantly increase the attacking team’s chances of creating a dangerous situation.
At its most basic level, packing measures the number of opponents bypassed by an action. However, modern analytical models often extend this idea by accounting for the context in which the action occurs.
A weighted packing model can be expressed as:
where:
WP = weighted packing score
Di = number of defenders bypassed by action i
wi = weight assigned to the action based on its location or tactical importance
n = total number of actions performed
The introduction of the weighting factor makes the metric more representative of real tactical value. Eliminating defenders near the opponent’s penalty area is generally more valuable than bypassing the same number of players in a harmless area of the pitch.
For example, imagine a player performs two actions:
Action 1 bypasses 3 defenders in the middle third of the field, with a weight of 1.2.
Action 2 bypasses 3 defenders near the opponent’s penalty area, with a weight of 2.5.
The weighted packing score would be:
WP = 3,6 + 7,5
WP = 11,1
Although both actions eliminate the same number of opponents, the second contributes more to the final score because it occurs in a strategically dangerous area.
Because packing models vary across data providers, there is no universal benchmark for what constitutes a “good” score. As a general guideline, analysts often associate higher packing values with players who consistently break defensive lines and advance possession. For instance, a weighted packing score around 5 may represent a meaningful contribution in a match, while scores above 10 can indicate particularly influential performances.
Historical leaders in packing metrics
Packing metrics have proven particularly useful when analyzing midfielders and deep-lying playmakers whose influence often extends beyond goals and assists.
Players such as Xavi Hernández, Toni Kroos, Sergio Busquets, Luka Modrić, and Andrés Iniesta have frequently been highlighted for their ability to bypass defensive lines. In women’s football, players such as Aitana Bonmatí, Keira Walsh, and Alexia Putellas offer strong examples of midfielders whose passing, positioning, and progression can be better understood through advanced football data.
The hidden equations shaping every match
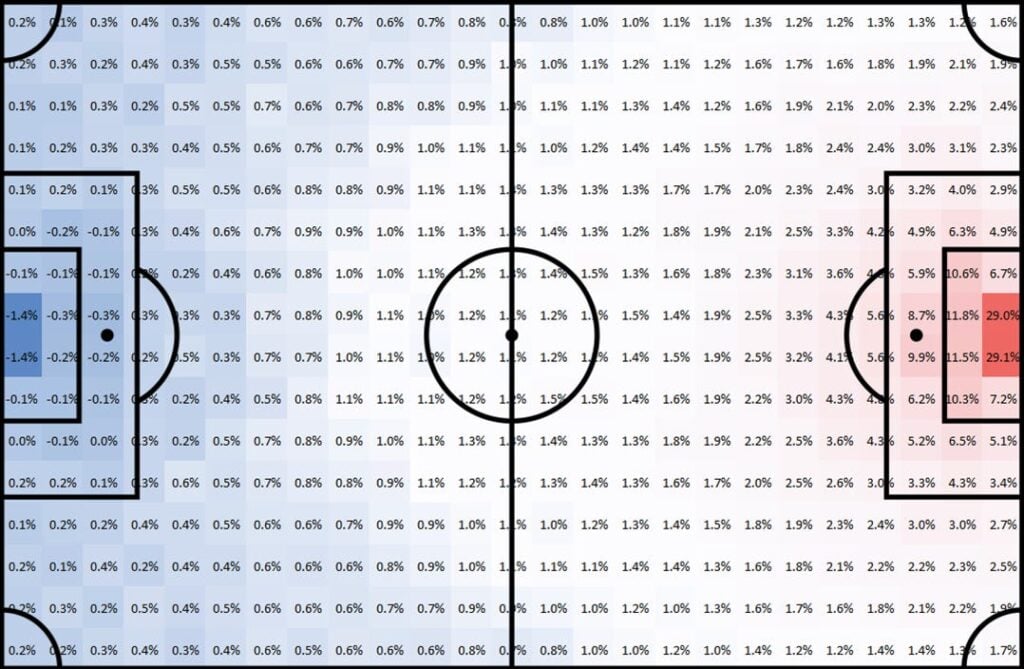
Another influential framework is Possession Value (PV), a family of models designed to estimate how much each action increases a team’s chances of scoring.
Traditional football statistics typically focus on outcomes such as goals and assists. Possession Value models take a different approach by measuring how every action changes the probability of scoring in the future.
The underlying principle can be expressed as:
VA = P(Goal | Action) – P(Goal | Previous State)
where:
VA = value added by the action
P(Goal | Action) = probability of scoring after the action
P(Goal | Previous State) = probability of scoring before the action
The vertical bar symbol “|” means “given” or “conditional on.” In probability theory, it indicates that the probability is being calculated under a specific condition.
In simple terms, the equation measures how much an action improves a team’s attacking situation.
A simple Possession Value example
Imagine a team is circulating the ball in its own half. Based on historical data, the probability of eventually scoring from that situation is estimated at:
P(Goal|Previous State) = 0,04
A midfielder then breaks two defensive lines with a progressive pass that reaches an attacker between the opposition’s midfield and defense.
After the pass, the probability of scoring increases to:
WP = (1,2 x 3) + (2,5 x 3)
The value added by the pass is therefore:
VA = 0,18 – 0,04
VA = 0,14
This means the pass increased the team’s scoring probability by 14 percentage points.
Importantly, the player receives credit for improving the attacking situation even if the move does not eventually result in a goal.

The mathematics behind VAR
Although VAR is often discussed from a refereeing perspective, it is fundamentally a mathematical and computational system that reconstructs the pitch and every player in three-dimensional space.
The system combines multiple synchronized camera feeds captured from different viewpoints around the stadium. By applying geometric triangulation, it estimates the position of each tracked point where the camera rays intersect, creating a precise 3D model of the match.
A simplified representation of a tracked point can be expressed as:
Position = (x,y,z)
where x, y, and z define its coordinates within a three-dimensional reference system.
Because every camera introduces small measurement errors, the reconstruction process also relies on camera calibration, image correction, and statistical optimization techniques. By combining observations from multiple viewpoints, the system minimizes uncertainty and continuously updates the 3D model in real time, providing the spatial accuracy required for key match decisions.
How computers decide the tightest offsides
Semi-automated offside technology represents one of the most sophisticated applications of computer vision currently used in professional sport.
The system relies on multiple high-speed cameras positioned around the stadium to continuously track players and the ball. Artificial intelligence algorithms identify key anatomical landmarks such as the head, shoulders, hips, knees, and feet, creating a digital representation of every player’s body.
Each tracked body point can be represented as a position in three-dimensional space:
Bi = (xi, yi, zi)
where:
Bi = body point i
xi = horizontal position on the pitch
yi = vertical position on the pitch
zi = height above the ground
By combining dozens of these tracked points, the system reconstructs a complete three-dimensional model of every player in real time.
Determining the offside line
Once the players’ positions have been reconstructed, the system identifies the most advanced legal scoring body part of both the attacker and the second-last defender.
The decision can be simplified as a comparison between their projected positions toward the goal:
O = xa-xd
where:
O = offside distance
xa = position of the attacker’s foremost legal body part
xd = position of the defender’s foremost legal body part
If:
O > 0
The attacker is beyond the defender and may be offside.
If:
O ≤ 0
The attacker remains onside.
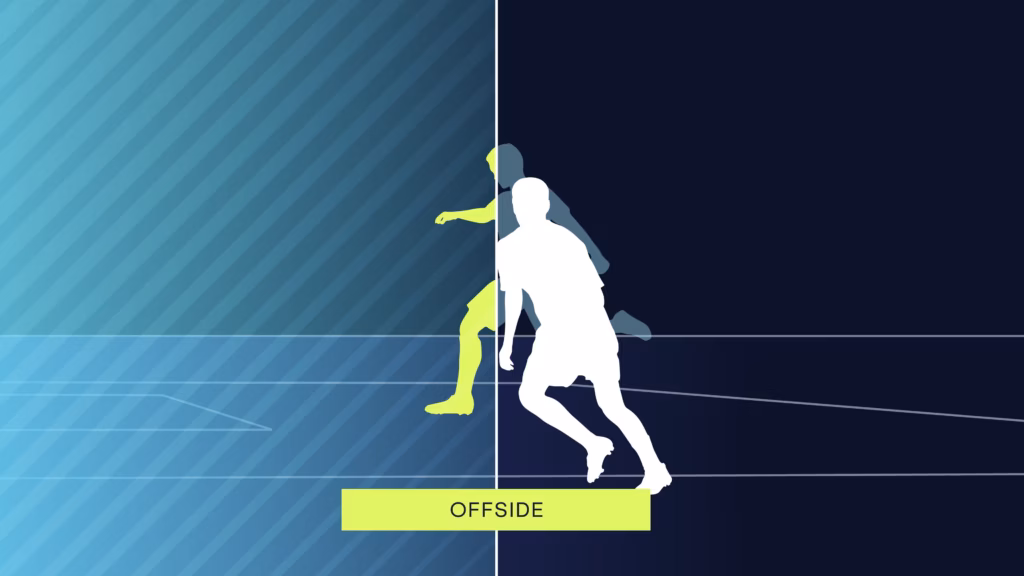
In practice, semi-automated offside technology continuously synchronizes player and ball tracking data to identify the exact moment a pass is played. Computer vision algorithms then reconstruct each player’s body position, automatically detect the relevant body points, and generate a virtual offside line that officials can review before confirming the final decision.
A simple offside example
Imagine that, at the moment a pass is played, the system records the attacker’s foremost legal body part at xₐ = 38.72 m, and the defender’s at x_d = 38.45 m. The offside distance is therefore:
O = 38,72-38,45
O = 0,27m
This means the attacker is positioned 27 centimeters beyond the second-last defender and may be offside. By performing these calculations automatically and in real time, the system helps officials evaluate extremely close decisions with greater consistency and precision.
Bringing football math into STEM education
Modern football provides a powerful real-world context for exploring STEM concepts. Metrics such as Expected Goals and Expected Assists introduce probability and statistics, while technologies like VAR and semi-automated offside detection demonstrate applications of geometry, computer vision, and data science.
Presenting these models often requires clear mathematical notation, particularly when explaining probabilities, predictive models, or spatial calculations.
MathType is Wiris’ mathematical equation editor designed to help educators, researchers, and content creators create professional mathematical notation across digital learning environments. Whether explaining Expected Goals models, visualizing possession value equations, or teaching the geometry behind offside detection, MathType makes it easier to communicate advanced mathematical ideas with clarity and precision.
Where football analytics goes next
The future of football data lies in increasingly sophisticated predictive models capable of evaluating every action on the pitch in real time.
As tracking technology improves and machine learning algorithms become more powerful, football clubs will continue to refine how they measure performance, identify talent, and make tactical decisions.
Behind every modern football stat lies a mathematical model that attempts to describe the game’s complexity. From Expected Goals and Expected Assists to packing rates and automated offside detection, football has become a powerful demonstration of how mathematics, data science, and computation are reshaping the way we understand sport.
Share


Discover why thousands trust MathType
Enjoy 30 days of free access to MathType for Office Tools.